1 Introduction to GIS a GIT
People live in space, and their activities affect this space. Spatial Information is crucial for almost all human decisions. We need to know where certain things are, how to move in the world, to achieve our goals and predict the consequences of other activities. Knowledge of spatial Information is useful in any case. People have traditionally obtained spatial Information from everyday experiences in their environment (for example, when hunting in the woods, they knew the area and boundaries of hunting, etc.). People’s mobility has increased, and we are often in situations where it is necessary to use geographic Information gathered by someone else.
Examples:
- Tourists use maps to find out which route leads to the destination.
- Service providers and commercial companies use statistical geo-relational Information for marketing analysis.
- Students use the geographical atlas to gain new knowledge about foreign countries.
- Urban planners use city maps to determine the permitted construction types for each block of development.
Let´s watch several episodes of Geospatial Revolution which indicate us the content of our course:


The invention of the computer in the middle of the 20th century and information technology have provided new ways of collecting, managing and presenting the Information. In recent decades, it is possible to observe the growing use of IT in the processing of geographic Information. Traditional paper maps are commonly created using IT, databases are used to collect geographic Data, and geographic information systems are used in demanding, previously impossible, analyzes.
Geographic Information (GI) is widely used in many areas and make a significant contribution to creating human life more comfortable. They are used in public administration (e.g. in cadastres), in urban, regional and state planning; they are used to increase efficiency in passenger and freight transport. Geographic Information is a key to adequate environmental protection. Geographic information technology can be used in any decision-making that has a spatial character.
Geoinformation Technologies (GIT) have become very widespread in recent years not only in scientific workplaces, but we are increasingly encountering them in everyday life. It became apparent use GPS (Global Positioning System); many of us have it in a car or mobile phone and use it for travel navigation. Similarly, we often encounter Remote Sensing (remote Earth exploration), where we see satellite images every day in the weather forecast. Last but not least, we often hear about GISs (geographic information systems), for example, in the operation of components ambulance services or land use planning.
Almost everything that happens somewhere in space. If we know where this is happening, such information can be crucial. Due to its importance, the location becomes the essence of many problems that the company has to solve. Just geographical tasks focus on solution of locational problems.Here are a few cases:
- Where to place the new hospital so that it is as accessible as possible to citizens?
- Transport companies need to design optimal routes and itineraries for their vehicles.
- Geodemographers model service areas of shopping centres or design locations for their construction based on knowledge of demographic characteristics of potential customers.
- Epidemiologists model the spread of diseases in space.
- Precision agriculture - deciding on the use of fertilizers and pesticides in different parts of the fields based on the agrotechnical characteristics measured in them.
These issues can be managed using Geographic Information Systems (GIS).
1.1 Geoinformatics
Geoinformatics (geographical informatics, geomatics) - deals with the development and application of methods suitable for solving specific problems in geoscience disciplines - with particular emphasis on the geographic location of objects.
Geoinformation technologies work with the spatial component of information. Spatial data (as part of information) is common of interest in geo-science issues. Experts in geo science disciplines examine the unique properties (attributes) of spatial objects, which we call geo-objects (geo-elements). Examples of geo-facilities can be, for the example river basin, settlement, river section, administrative unit, etc.
Geo-objects are determined by their location (localization) in geographical space:
- absolute position - is described by ** geometry ** of the geo-object,
- topology - describes spatial relationships between geo-objects (relative position),
- special thematic domain of geo-objects - can be described by attributes,
- dynamics of geo-objects - is expressed by a change in geometry, topology and thematic domain (descriptive properties) over time If we want to work with the spatial properties of geo-objects, we need special analytical methods.
Geoinformatics is a relatively new discipline in geosciences.
Recommended literature:
Solari, O. M., Demirci, A., van der Schee, J. (2015): Geospatial Technologies and Geography Education in a Changing World. Springer, New York.
1.2 Geographic Information Systems
1.2.1 What is behind the acronym GIS?
Information System can be easily defined as a system that allows data storage and obtaining information from them. Besides, there is a link in the name Geographic Information System on geography, which is a science dealing with the study of the Earth’s surface (from the Greek words geo - earth, graphein - to write).
Geographic Information system (GIS) is, therefore, an information system for working with data that they contain a geographical component, i.e. they describe places on the earth’s surface. This data includes explicit expression of position - they store the coordinates of points on the earth ’s surface (generally in space). We call such data spatial data. Data that does not contain location information we call non-spatial data.
In addition to coordinates, spatial data usually contains other information, such as data the set of cities in the Czech Republic may, in addition to the coordinates of the centres of individual towns, also contain their names and population numbers. Spatial data, therefore, have a spatial and a non-spatial component. Non-spatial the data folder is also called the descriptive data folder or attributes.
Geographic information systems are computer-aided systems for storing and processing geographic information. They are tools that improve the efficiency and effectiveness of manipulating information related to geographic objects and events. They can be used to perform many useful tasks, including storing vast amounts of geographic information in databases. It is also used to perform analytic operations in a fraction of the time that would be required to complete them manually. It is also used to automate mapping procedures.
There are a large number of GIS definitions, but none of them is exhaustive. Here are some of them to illustrate:
Definition of ESRI: GIS is an organized set of computer hardware, software, and geographic data designed to efficiently acquire, store, edit, manage, analyze and display all forms of geographic information.
Phil Parent (1988): GIS is a “system that contains spatial data that can be analyzed and converted for information for specific purposes or applications. A key feature of GIS is ** data analysis ** to obtain new information.”
Burrough and McDonnell (1998): “GIS is a powerful set of tools for collecting, storing, selecting on demand, transforming and displaying real-world spatial data for specific purposes.”
However, the concept of GIS is perceived differently by experts in this field, differently by everyday end-users and complete non-specialists. Table 1 contains the various GIS definitions and the groups that consider these definitions useful.
Table 1: GIS definitions and groups that find the definitions useful.
| definition | groups using this definition |
|---|---|
| digital maps | general public |
| a computer tool for solving geographical problems | decision-makers, communities, planners |
| spatial decision support system | scientists working in management, researchers |
| an organized set of territorially distributed phenomena and devices | public service administrators, transport infrastructure officials, resource managers |
| a tool for revealing what would otherwise remain hidden in geographic information | scientists, researchers |
| equipment for performing operations with geographic data that are too tedious, expensive or inaccurate when performed manually | resource managers, planners |
(source: Longley, P. A. et al. (2016): Geographic Information: systems and science. Wiley&Sons, Inc.)
Watch the video: Introduction to GIS:

1.2.2 GIS History
There are several controversies in the history of GIS, related to the fact that these systems have been developing in parallel in North America, Europe and Australia. The first real GIS is the Canadian Geographic Information System (CGIS) developed in the mid-1960s. It was mainly a large-scale government project to Canadian inventory land. Another significant innovation was the DIME (Dual Independent Map Encoding) program, which was used to plan the tools needed for the 1970 census. This program created digital records of all US streets to support automatic referencing and collection census records. Harvard University then developed an extensive program Laboratory for Computer Graphics and Spatial Analysis to develop general-purpose GIS. In the 1970s, the ** ODYSSEY GIS ** software appeared.
We can consider the field of cartography as a separate branch of GIS development. Cartographers began to realize that computer processing of cartographic operations could lead to lower costs and shorter mapping times. A pioneer in this area became the British Experimental Cartographic Unit (ECU) in 1968, which published the first computer-generated map, used postal codes as geographical references, etc. State mapping authorities (British Ordnance Survey, French Institut Géographique National, US The Geological Survey and Defense Mapping Agency - now the National Geospatial-Intelligence Agency) began researching the use of computers to support map editing. The aim was to eliminate the expensive and slow process of manually editing and reproducing maps. The first steps in automated cartography were taken in the 1960s, and by the end of the 1970s, most mapping companies were already using computers to some extent. However, the United Kingdom didn’t achieve full digitized map coverage of the territory until 1995.
Remote sensing also played a role in the development of GIS. It has become a source of technology and data. The first military satellites from the 1950s were developed and deployed with great secrecy to gather intelligence. The declassification of much of this material in recent years has provided an exciting insight into how military and intelligence services have contributed to the development of GIS. Although the first spy satellites used a conventional film camera for imaging, the digital remote sensing technoglogy replaced film camera in the 1960s. By the 1970s, civilian remote sensing systems (such as Landsat) already provided tremendous new sources of space-based Earth surface data. They used technologies that classified images and recognized structures.
The military was also responsible in the 1950s for the development of the first unified site targeting system for accurate targeting of intercontinental ballistic missiles. This development has led directly to new positioning methods that are still used today. Military needs also stood at the beginning of the development of the Global Positioning System (GPS).
The rapid development of GIS did not occur until the early 1980s when computer hardware prices fell so much that they enabled the large-scale development of the software industry and cost-effective applications. The first customers included forestry companies and authorities managing natural resources, which was due to the need to monitor large forest complexes and effectively regulated their use. Since the late 1980s, GIS has seen a 10-20% annual increase in many countries. In most cases, the availability of trained, specialized staff limited growth. The market for GIS software has continued to grow, computer prices have been falling, and the growth of the GIS software industry has not stopped since.
In the 1990s, GIS became an advanced technology. Specialized companies sold alternative systems for specialized markets, which were built on a multi-purpose GIS (ESRI, Intergraph, Siemens, Unisys, Smallworld), or independent software. The markets are also application-specific (real estate cadastres, hydrological data, etc.) or national markets with specific requirements for language support, specific administrative tasks and training needs.
Current developments are moving towards components in an “open GIS” environment, where new companies do not offer complete GIS, but only some specialized parts. These companies work with vendors that sell generic platforms. Many “small GIS” have only limited functionality; one of the functions is usually the viewing of data that have been acquired and organized in one of the complex systems. The market for systems with minimal capabilities has been influenced by Microsoft’s decision to include the MapPoint Geographic Data Viewer in Office.
Table 2: brief characteristics of different GIS periods
| 1960 - 1969 | 1970 - 1979 | 1980 - 1989 | 1990 - 1999 | 2000 - present |
|---|---|---|---|---|
| hardware | software | data | applications | networks |
(source: Frank et al., 2000)
Longley et al. (2016) recognize three important periods in the development of GIS:
- period of innovation - 1957 - 1977 - the first known automatically created maps (Swedish meteorologists, British biologists - 1957), the beginning of GIS development (CGIS - Roger Tomlin - 1963), the establishment of the Association of Urban and Regional Information Systems (URISA - USA - information exchange among GIS innovators), Laboratory for Computer Graphics and Spatial Analysis (Harvard - 1964), 1966 - SYMAP (first raster GIS), 1967 - US The Bureau of Census develops DIME-GBF (Dual Independent Map Coding), 1969 - Establishment of ESRI (Jack and Laura Dangermond), 1969 - Establishment of Intergraph Corp. (Jim Meadlock and colleagues - navigation system for Saturn rockets), 1969 - book “Design With Nature” published (Ian McHarg - first description of modern GIS analysis concepts), 1969 - first GIS technical textbook (Nordbeck, Rystedt), 1972 - Landsat released 1 (DPZ), 1973 - first digitized production line (Ordnance Survey), 1974 - AutoCarto 1 conference, 1976 - worldwide use of GIMMS (vector mapping system - created by Tom Waugh), 1977 - ODYSSEY (topological data structures);
- period of commercialization - 1981 - 1999 - ArcInfo’s entry into the market (1981), 1984 - publication “Basic Readings in Geographic Information Systems” (Duane Marble, Hugh Calkins, Donna Peuquet), 1985 - GPS commissioning, 1986 - book “Principles of Geographical Information Systems for Land Resource Assessment” (Peter Burrough), 1986 - the establishment of MapInfo Corp., 1987 - the establishment of the Journal of Geographical Information Systems (now IJGI Science), 1988 - the establishment of GISWorld (the first global journal), 1988 - created TIGER system (Topologically Integrated Geographic Encoding and Referencing), 1988 - the establishment of research centres in the USA and Britain (US NCGIA, UK RRL), 1991 - compendium Geographic Information Systems: Principles and Applications published (David Maguire, Mike Goodchild, David Rhind), 1992 - DCW (Digital Chart of the World) - 1.7 GB), 1994 - OpenGIS Consortium (today Open Geospatial Consortium), 1996 - Internet GIS products appear, 1996 - MapQuest (Internet Map Service), 1999 - First GIS Day;
- utilization period - 1999 - present - IKONOS (1999 - new generation of satellite sensors with high resolution 90 cm on the earth’s surface, 2001 - Quckbird - resolution 62 cm), 2000 - GIS industry exceeded the limit of 7 billion USD, 1 million users, 2002 - launched US National Atlas Online, 2003 - launched UK National Statistics Online, launched Geospatial One-Stop project (the largest GIS user in the world), 2006 - Google Earth project launched (first virtual globe - 150 million downloads in the first 12 months), 2007 - Pitney Bowes, Inc. buys MapInfo (maker of e-mail machines), Nokia buys Navteq, 2008 - TomTom buys TeleAtlas (a relatively new consumer GIS company buys street data providers).
1.2.3 GIS Anatomy
Despite its complexity, GIS has distinct components (see Figure 3). Today, the most basic part of the system is the network, without which there would be no rapid communication or information sharing. At present, GIS relies heavily on internet and its “cousins” with limited access, i.e. intranets companies (authorities, army, etc.). The Internet emerged as a US Department of Defense communication project called the Advanced Research Project Agency Network (ARPANET) in 1970. In 1980, Tim Berners-Lee (researcher at the European Organization for Nuclear Research (CERN) developed the hypertext structuring of the text that underlies the network World Wide Web (WWW) It is a crucial application that has brought the Internet into everyday life.
In the early days of the Internet, GIS became an attractive application that stimulated many people to start using the Web. GIS, on the other hand, also benefited significantly from the adoption of the Internet concept. The use of GIS on the Internet is relatively broad: dissemination of information, search for routes, sale of goods and services, revenue management by subscription (e.g. mapquest.com/solutions), helping the public to participate in relevant local, regional and global discussions. Since the beginning of the 21st century, the portability of Internet technologies has been increasing. Users can use GIS with wireless networks available in public places (airports, railway stations, etc.) within various devices (laptop, pager, mobile phone, PDA). This leads to a rapid development of the GIS services sector, resulting in further use of the abbreviation GIS: “geographic information services”.
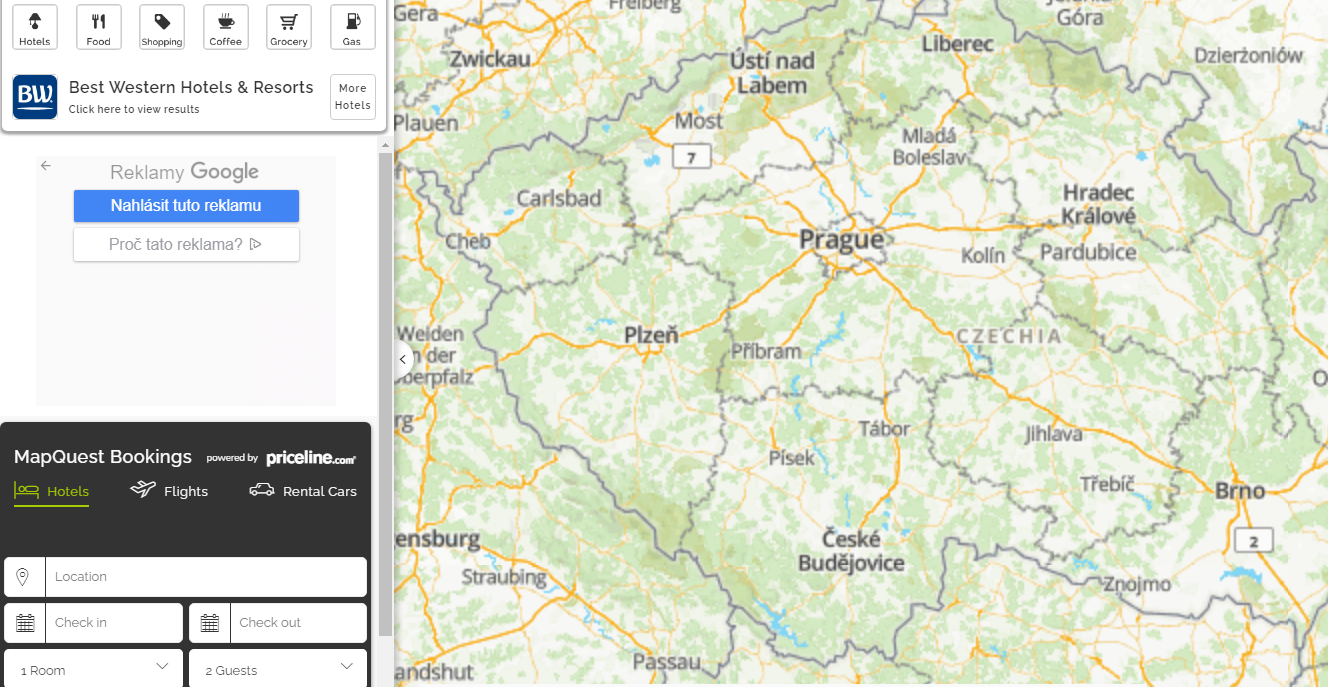
Figure 1: www.mapquest.com
Thematic, geographic networks have also developed rapidly in recent years, such as U.S. Geological One-Stop, one of 24 US Federal Government initiatives in the field of electronic public administration.
The Internet is, therefore, the core for many ways of using GIS. The era of isolated GIS systems is more or less over.
For all applications of this type, the Internet provided a one-way flow of data to a large number of users of the websites that together formed the worldwide WWW. This system gradually evolved into the so-called Web 2.0, i.e. a network that today allows two-way collaboration between users and websites. The geographical form of these ideas is called GeoWeb 2.0. The concept of the Web 2.0 network was stimulated mainly by two technologies: * Asynchronous Javascript And XML (AJAX), * Application Programming Interface (API).
AJAX enables the creation of web pages that are similar in appearance and concept to desktop applications. These technologies have significantly improved the usability of web mapping by allowing direct manipulation of map data, where the interaction between the user and the app immediately displays on the monitor.
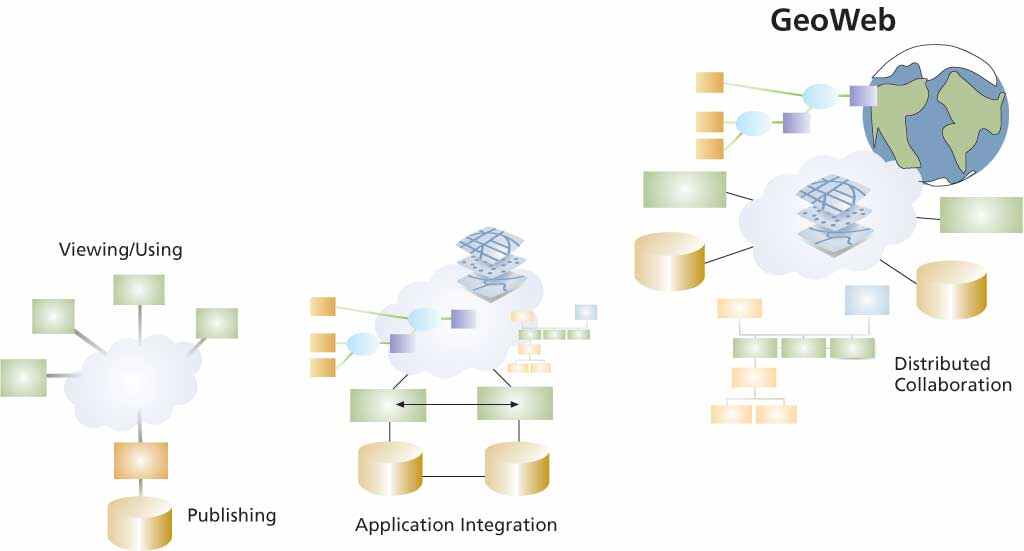
Figure 2: GeoWeb (source: https://www.esri.com/news/arcuser/0206/geoweb.html)
The technical part of GIS consists of computer hardware (hardware), a set of programs (software) and data. User hardware, with which the user is in direct interaction in the operation of GIS is not only a desktop computer, but it can also be a laptop, PDA, telephone, devices installed in the car and more. In-network language, a user’s device is called a client. It is connected to the server by a network, which currently serves more other clients.
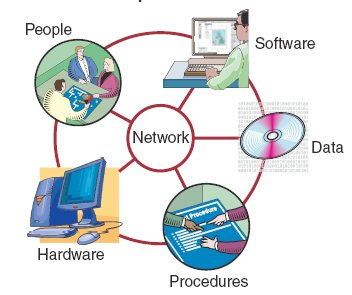
Figure 3: GIS components (source: Onu, F. U. et al., 2016)
Client could be:
- thick - perform much of the work locally alone,
- thin - strongly depends on another computer to perform its task (they only offer browsing functions).
Software installed locally on the user’s device forms another GIS component. It can have the functions of a simple web browser (Microsoft Explorer, Safari and others) if all work is performed remotely using selected digital services offered by large servers. More often, however, it is a software package purchased from GIS resellers (Autodesk Inc., ESRI, Mapinfo Corp. …). Each vendor offers a range of products designed for different levels of sophistication, different data volumes and different customer groups. An exception is IDRISI (Clark University, Worcester, Mass.), Which is an example of a GIS created by an academic institution and sold by a non-commercial reseller.
Commercial software is rarely “open-source”. This fact means that users cannot modify its code. There are many reasons for this (copyright, providing support to users). However, even freely distributable software (e.g. GRASS GIS, SWARM, Repast) often does not fall into the “open-source” category for the same reasons. There is an online guide (Spatial Analysis Online) by Michael De Smith and colleagues to raise awareness of the full range of program options available and the quality of the results they can obtain.
The fourth component of GIS is the database. It can have a volume of only a few MB, but it can also contain data of a few TB (terabyte) or PB (petabyte) and more (see Table 3).
Table 3: Approximate volumes of GIS databases for some typical applications of these systems (rounded to the nearest order of magnitude). The data strictly adheres to the binary system (1 kB = 1024 bits).
| unit | size | application example |
|---|---|---|
| one megabyte | 1 000 000 | one data file in a small project database |
| one gigabyte | 1 000 000 000 | street network of a big city or a small country |
| one terabyte | 1 000 000 000 000 | elevation model of the Earth in 30m intervals |
| one petabyte | 1 000 000 000 000 000 | satellite image of the Earth’s with a resolution of 1 m |
| one exabyte | 1 000 000 000 000 000 000 | view of the whole Earth with a resolution of 10 m |
(source: Longley et al., 2016)
In addition to the components mentioned above (networks, hardware, software, data), GIS also requires control. The organization must establish procedures, hierarchical links, management points and other mechanisms to ensure that GIS activities meet its needs, do not exceed the budget, are of high quality and generally provide what is needed. GIS will be useless if the people who design, program, maintain, fill in the data and interpret the generated results will not.
Look at 1000 GIS Applications & Uses – How GIS Is Changing the World!
1.3 Data, information, knowledge, geodata, geoinformation
Let’s start from the Interpretive Dictionary of the Czech Association for Geoinformation (CAGI) for the field of geoinformatics (Rapant, 2006):
Datum is probably the most general term in terms of the description of the real world in information systems. It is defined as follows:
Datum is the basic unit of the information image (description) of a real-world object, usually recorded in informalized form.
Data are defined as representations of facts, concepts or instructions (instructions, guidelines) in a formalized way suitable for communication, interpretation and processing by humans or by automatic means.
Information is defined as a meaningful interpretation of data and the relationships between them.
We can consider the data as a more general term, entries being a subset of data that is characterized by a formalized notation enabling computer processing.
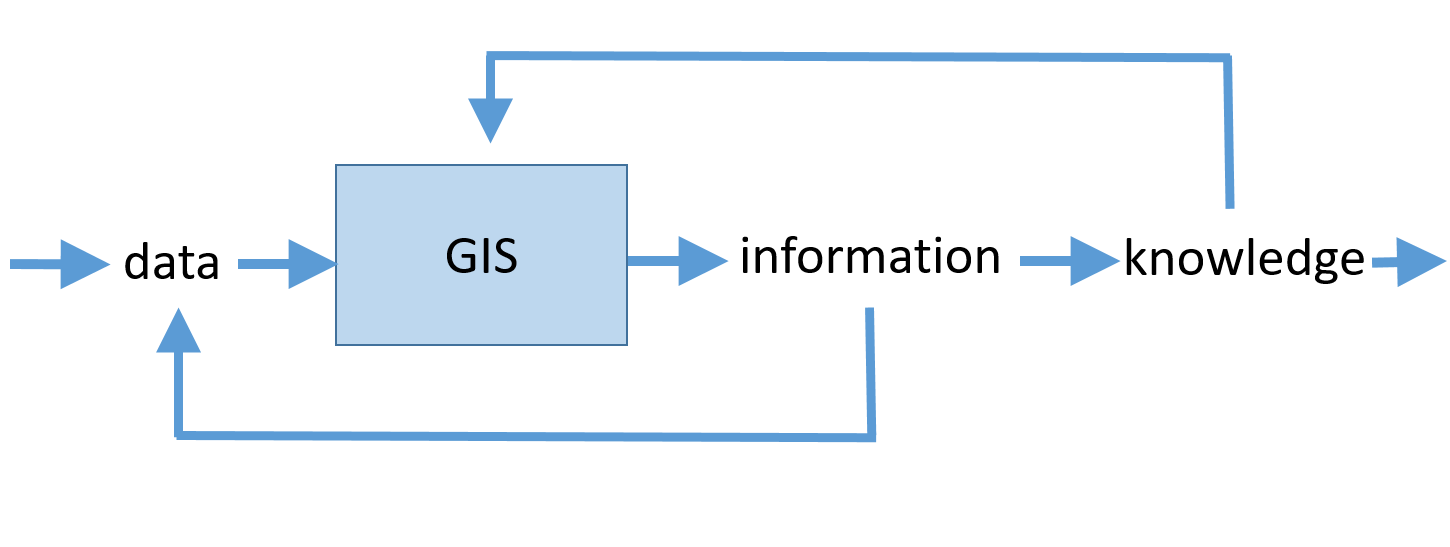
Figure 4: data, information, knowledge, its mutual relationship and relationship to GIS (source: Rapant, 2006)
The relationship between data and information can also be defined as specified in ČSN 36 9001:
Entry (datum) is an image of a property of an object, suitably formalized for transmission, interpretation or processing by humans or automata. Information is the meaning that a person attaches to data.
We assign meaning to data based on our knowledge. And vice versa - based on the obtained information we refine our knowledge, resp. We get new ones. It can also be displayed using the DIKW pyramid, also known as the DIKW hierarchy, the expertise or information hierarchy, or the data pyramid. It is an information model, explaining the structural and functional relationships between data (know-nothing), information (know-it), knowledge (know-how) and wisdom (know-why). The hierarchy suggests that data is the complete foundation on which higher categories build. With the help of data, we can form information, from information knowledge and the highest degree then develop wisdom. All stages always contain the previous steps.
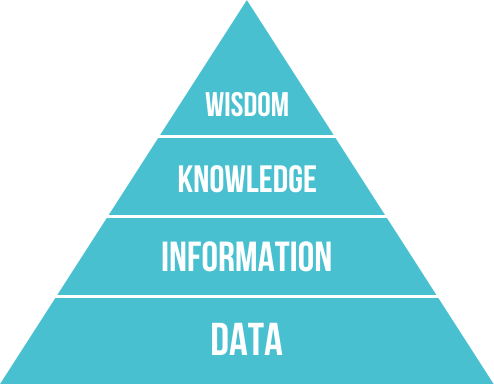
Figure 5: DIKW pyramids (source: https://cs.wikipedia.org/wiki/DIKW_pyramida)
It is possible to talk about information on two levels of meaning (Rapant, 2006). Either it is in the sense of the message, it now brings something new to the recipient, or we consider any information provided to the recipient as information. Although the first approach is theoretically more correct, in practice, the second approach is usually prevalent. This is because it is generally difficult to define to what extent the content of the message is indeed new to the recipient.
In general, what we enter into a geoinformation system and what we process using this system will be referred to as data. The results of processing this data will refer to as information. At the same time, it is necessary to realize that what we obtain once as new information can be immediately used as input data for further analyzes. Furthermore, we derive the output information in the geoinformation system from the input data on the basis of existing knowledge. During additional work with the obtained information, the processor can derive new knowledge, which can again be projected into the geoinformation system and thus influence the acquisition of further information from the input data.
Example (Rapant, 2006): We have two databases. In one we have data on average annual temperatures for various places on the Earth’s surface, in the other, we have data on the distribution of typical flora and fauna in different areas of the Earth. By processing this data using knowledge of spatial interpolation, it is possible to create maps that show the distribution of average annual temperatures on earth and the distribution of typical flora and fauna. We obtained information about the placement of these factors on the earth’s surface. We can now find the estimated annual average temperature for virtually any place on Earth. By their joint interpolation (based on the use of existing knowledge about the study of the interdependence of quantities) we can find that there is a dependence between the distribution of the average annual temperature and the typical flora and fauna. We have gained new knowledge: we know that there is a strong relationship between the average annual temperature in a given place and the occurrence of typical flora and funya. Based on the value of the average annual temperature in a given site, we can now conclude the appearance of typical flora and fauna in the same area.
The term metadata is also widely used in connection with data today. We can define it as data about data or datasets. It is a very simplified definition, but it captures the essence of the problem well. A more comprehensive definition might look like this:
Metadata is data describing the content, representation, scope (spatial and temporal), spatial reference system, quality and administrative, and possibly also business aspects of the use of digital data.
Thus, it is the data that the user needs to be able to find, retrieve and use the required data (or data set) in an appropriate manner, i.e. to prevent their misuse.
Today we widely discuss the concept of metadata, and as well we can also address the ideas of meta-information and meta-knowledge. Just as metadata specifies the possible use of data and thus the range and quality of information that obtained from the data, so meta-information describes its information and allows the user to judge the possible knowledge of the modelled environment that gaining by using this information.
Meta-information (or metadata about information) describes the relevant information in more detail: the quality of the data used to obtain them, the quality of the processes leading to their acquisition, the algorithms used, etc. so that the user can get an idea of how they can be used for what can be inferred from this information, what knowledge can be derived from them.
Metanowledge (resp. Metadata about knowledge) describes in more detail the own knowledge, the quality of information used for its derivation, the quality of processes leading to their derivation, the algorithms used, etc. so that the user - adopter of this knowledge can get an idea how to handle them.
Recommended literature:
- Longley, P. A. et al.(2016): Geographic Information: systems and science. New York: Wiley & Sons, Inc.
- Duckham, M., Goodchild, M., F. and Worboys, M. F. (2003): Foundations of Geographic Information Science. London and New York: Taylor & Francis.
Articles:
- ArcUser Online: The GeoWeb—A Vision for Supporting Collaboration
- Maguire, D. J.: GeoWeb 2.0 and Volunteered GI