The most challenging problem in GIS is always the construction of a geodatabase, ie the provision of the necessary geographical data in the form of maps, databases, statistics and the like. It is stated that more than 70% of the cost of creating an application falls on the acquisition of data.
We must first clarify the concept of spatial data.
Spatial data
As already mentioned in the definition of GIS and GIT, these technologies work with a special type of data, namely spatial data. There are a number of definitions of the term spatial data, such as McDonnel and Kemp. (1995) state the following:
Spatial data is any data that contains a formal positional reference, such as a reference to a grid cell. These are, for example, remote sensing data or maps.
Rapant (2006) uses this definition:
Spatial data are data that relate to specific places in space and for which the known location of these places is at the required level of resolution.
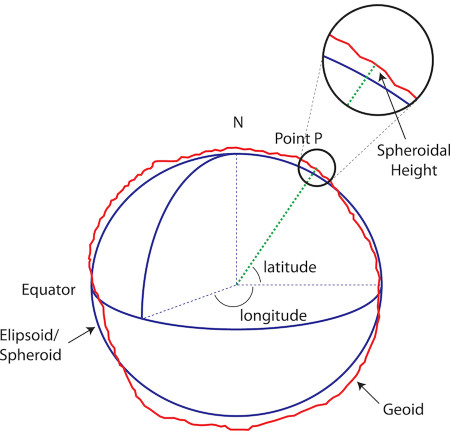
E.g. for geographic data, as one of the types of spatial data, the geographical location of a place on or near the earth’s surface to which the data relate is given, which is given, for example, by geographical coordinates.
Other data that do not fall into this group, ie data for which the location of the places to which they relate is not defined or at least not known at the required level of resolution, are referred to as non-spatial data.
Rapant (2006) explains the difference between the two concepts with a simple example:
We have a database of all citizens of the Czech Republic, in which, among other things, the date of birth of each citizen is stated, but the place of permanent residence is not stated here. From such a database, we can, for example, calculate the average age of men and women living in the Czech Republic and use this data when compiling a thematic map of Europe, where these data will be shown for each country. From this point of view, it can be stated that at the considered level of data localization resolution (European countries) we work with spatial data. However, if we want to draw a map of the distribution of these two quantities at the level of districts of the Czech Republic, then this database is unusable. From this point of view, the data in it are non-spatial, because they lack the spatial location corresponding to the required level of resolution (for each citizen) there is no data on the district in which he has a permanent residence)..
From this simple example, it is clear that the boundary between spatial and non-spatial data is not clear, it depends not only on the presence of position data in space, but also on their level of resolution and the requirements of a particular application. It is also clear that if the data does not contain any (even indirect) position data and the position does not follow from the context, if such data are always non-spatial.
The data that ensures the binding of data to a specific place in space is called spatial reference (georeference). Ideally, this spatial reference is directly coordinates (in space, on a map), but it is usually an indication that determines the location indirectly, such as address, parcel number, name of state, district, city, city district, etc.
The term geodata is often used as a synonym for spatial data. Despite the fact that these terms do not in fact have exactly the same meaning (in the case of geodata, the space in which their position can be defined is reduced only to the earth’s body and the surrounding environment), we will allow their interchangeability.
As stated by Rapant (2006) on the example of a Norwegian study and others, 50 - 80% of data processed by public administration, resp. the decisions it makes are spatial in nature. Furthermore, various surveys show that the main users of geodata, such as construction, public administration, agriculture, forestry and other natural resource managers, telecommunications, transport, distribution networks, etc., spend 1.5-2% of their budget on geodata.
Geodata can be divided into two basic groups (Rapant, 2006):
- basic geodata (in a broader sense) - necessary for most GIT applications,
- application dependent geodata - application specific.
Basic geodata
Basic geodata is now defined in two ways:
- so-called reference geodata,
- so-called common base geodata.
Reference geodata
The concept of reference data is based on two ideas:
- It is a series of data sets used by each user of geodata and geoinformation technologies to spatially reference their own geodata.
- These datasets provide general spatial connectivity between different applications, providing a convenient tool for sharing knowledge and information between people.
Referential geodata are used as a common basis, enabling thematic (or application-dependent) geodata to be referenced. It must meet the following requirements:
- enable unambiguous localization of user information,
- enable seamless connection (integration) of geodata from different sources and from different providers,
- provide a context that allows other users to better understand the information presented.
It should contain the following components (Rase et al. - in Rapant, 2006):
- geodetic reference geodata,
- administrative units,
- plots and buildings (boundaries of ownership units),
- addresses,
- selected topographical topics (water, transport, elevation),
- ortophotos,
- geographical names.
In the conditions of the Czech Republic, examples of reference geodata can be data ** ZABAGED ** (Basic database of geographical data) provided by the Czech Surveying and Cadastre Office (ČÚZK) or data DMU-25 (Digital Territorial Model 1:25 000) provided by the Military Geographical and Hydrometeorological Office (vGHMÚ). However, their structure does not fully meet the above requirements.
ZABAGED
Digital geographical model of the territory of the Czech Republic, which with its accuracy and detail of the geographical reality display corresponds to the accuracy and detail of the Basic Map of the Czech Republic at a scale of 1:10 000 (ZM 10) in the coordinate system S-JTSK (WGS84, S-42) and the Baltic altitude system - after settlement (Bpv).
The content is defined by a catalog of objects structured into 8 thematic categories, 123 basic types of geographical objects and more than 350 types of descriptive attributes. Objects are represented in the digital database by a vector topography and appropriate descriptive and qualitative attributes.
ZABAGED contains information on settlements, roads, distribution networks and product pipelines, water supply, territorial units and protected areas, vegetation and surface and elements of terrain relief. ZABAGED also includes selected data on geodetic, elevation and gravity points in the Czech Republic and an elevation represented by either a spatial 3D set of contour lines or a 10 x 10 m grid.
The initial fulfillment was started by the Embassy in 1995 by vector digitization of ZM 10 print materials. This basic digitization was completed in 2001, with the exception of the development of settlements.
In the period up to the end of the 1st quarter of 2004, it was supplemented with geographical objects of settlements, other descriptive and qualitative attributes were added to the database, including selected types of identifiers, and individual storage units in the ZM 10 clade were combined into a “seamless” database.
At the same time, since 2001, the first nationwide update has been carried out with the aim of specifying and updating the topographical component and revising and supplementing the attribute part of the database. In particular, photogrammetric methods and topographic surveys in the field were used. This first update was completed in 2005.
In 2005 and 2006, in addition to the ongoing data update, a new update and management technology was designed and operationally deployed at the end of 2006:
- A central database has been created, which will continue to be updated online from detached territorial offices of the Embassy. At the same time, the central offices of the Embassy in Prague will ensure the updating of selected elements in cooperation with the central state administration bodies with the aim of ensuring the system links of public administration information systems.
- Further periodic updates and additions will be implemented in three-year cycles using always newly processed aerial survey images and color orthophotos, which will be created annually for one third of the territory of the Czech Republic.
- Data are currently provided throughout the map sheets in clade ZM 10, in the selection of data in the range of regions, or as a comprehensive seamless database from the entire territory of the Czech Republic as vector files topography (2D) in DGN format, or with attributes in MPD for application in Intergraph software environments, or in SHP format for application in ESRI software environments, and in GML format.
- In 2001, the Embassy began processing a digital raster cartographic model of the area from the vector topographic model ZABAGED. This new form of raster ZM 10 already covers the entire territory of the Czech Republic.
- The data is in the S-JTSK coordinate system and the Bpv altitude system. Placing TIFF files in the coordinate system using TFW files. It is also possible to provide files for georeferencing to the WGS84 system - UTM display, or to the S-42.
- Raster data is provided in two variants: 1. Color “seamless” image 1: 10,000 - 400 dpi, 2 x 2 km square; positive of squares in S-JTSK for download here: http://www.cuzk.cz/segmenty10.zip2. The image “in layers” m.l. ZM 10 - the image is divided into ten layers. Either a set of ten layers (complete content) or individual layers is provided; 400 dpi, approx. 18 km2, CIT, TIFF.
DMÚ 25
The second important source of quality topographic data is a military map work. The administrator of digital products derived from military topographic maps is the Military Geographical and Hydrometeorological Office (VGHMÚř) based in Dobruška. The copyright for this work is managed by the General Staff of the Army of the Czech Republic. Here, too, we find both raster maps and vector databases, as part of the military topographic information system (VTIS) under construction. A work comparable to ZABAGED is the digital model of the DMÚ 25 area. It is a vector database topographic information about the territory, which with its accuracy and content corresponds to military topographic maps at a scale of 1:25 000, called TM25. The database contains topographic objects divided into 7 thematic layers - water management, settlements, communications, network management, borders and enclosures, plant and soil cover and terrain relief. The database is a seamless digital model of the entire territory of the Czech Republic with a slight overlap across the state border. Unlike the ZABAGED database, it does not end at the state border, but still shows a few kilometers wide range of neighboring states.
DMU 25 is available as an IMS and WMS2 service at CENIA Geoportal.
The scale (or spatial resolution) depends on the level of use of the reference geodata. Table 1 lists the spatial resolution ranges and scale ranges as proposed in Rase et al., 1995 (in Rapant, 2006):
Table 1: Spatial resolution ranges and scale ranges for individual levels of reference geodata
| European |
> 100 m |
small scales |
< 1 : 250 000 |
| national |
~ 25 m |
medium scales |
1 : 100 000 - 1 : 250 000 |
| regional |
~ 10 m |
medium scales |
1 : 25 000 - 1 : 50 000 |
| local |
< 2,5 m |
large scales |
> 1 : 25 000 |
Common base geodata
Common base geodata is meant a set of geodata necessary for optimal use of most GIT applications, ie geodata that represents a sufficient (spatial) reference for most spatially related data. Basic geodata can thus include a much lower number of geoelements necessary for the presentation of a given topic.
This geodata should be freely shared by all users to provide a localization basis for all applications and to minimize the costs associated with the creation and maintenance of basic geodata (Rapant, 2006).
basic geodata has long been acquired and disseminated in analogue form by geodetic and cartographic organizations. Today, they are used mainly in digital form. Using GIT, they can be acquired, disseminated, modified and combined with other data in various ways.
Application dependent geodata
Application-dependent geodata covers all other areas of geodata that can be used in individual applications. Examples are socio-economic data, data on natural resources, or even targeted versions of basic data (e.g. road centerlines for vehicle navigation). These are mostly thematic data.
According to the nature of the obtained input data, we divide the sources:
- Primary - among the primary sources we include all forms of field measurements, which we perform precisely for the purpose of building our geodatabase. Data is created from nothing, we have the opportunity to influence a lot of parameters related to their acquisition and especially their credibility and accuracy. However, data acquisition can be very laborious, expensive and time consuming. It can be assumed that we will embark on this in situations where we have no other choice.
- Secondary - all forms of data acquisition from already finished geodatabases, which were originally created for other purposes (once they were primary). This data source is the most common. There are even institutions involved in collecting data and selling licenses for geodata. We will probably try this source of data when it is more economical than acquiring it in person. The disadvantage of secondary data sources is their probable deviation from our specific intention.
Primary data sources
Primary sources include all measurements that took place by the direct presence of the meter in the given locality in the form of direct contact of the measuring device with the investigated phenomenon (various forms of geodetic measurements) or some variant of taking a picture in a non-contact way - from a distance (remote sensing).
Remote Sensing is a well-known abbreviation for Remote Sensing.
It is a discipline based on the study of reality from a distance. In practice, we find the following forms of remote sensing:
- Aerial photography - taking photographs of the terrain surface from a relatively low-flying aircraft. The Brno company Geodis clearly leads in this discipline in the Czech Republic.
- Scanning objects from the Earth’s surface - for example, laser scanning of a 3D object (buildings).
- Multi-spectral imaging of the Earth from a great distance using space satellites (on polar orbits or geostationary orbits) or, for example, meteorological balloons in the uppermost layers of the atmosphere.
Other fields related to photo processing are related to photographing the Earth from a distance - photogrammetry and photointerpretation.
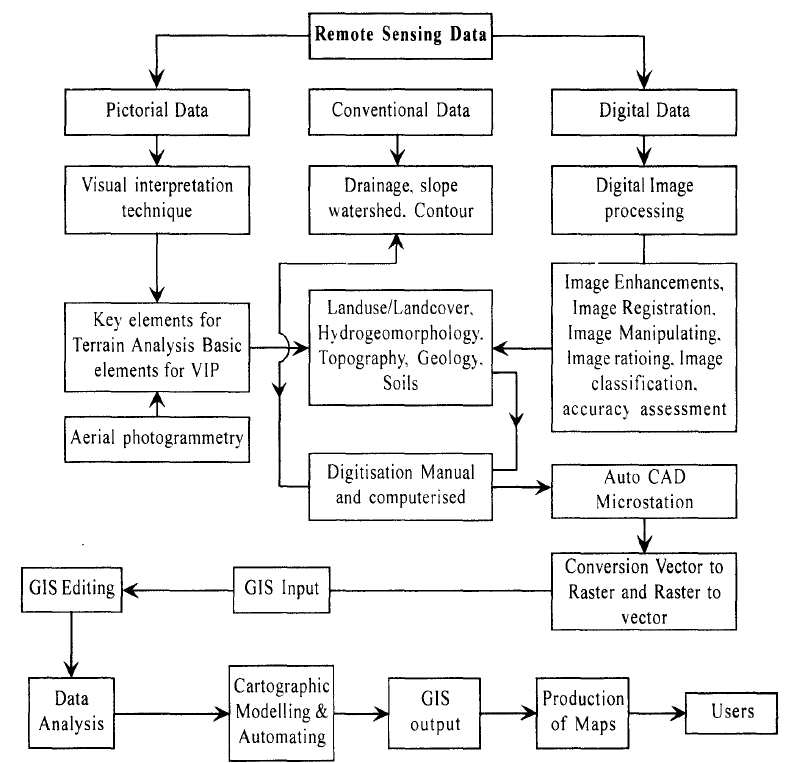
Figure 3 shows an overview of the linkage of Remote Sensing and GIS.
Imaging Sensor Systems
Various components of sensor systems operating in the visible, infrared, thermal
and microwave regions of the electromagnetic spectrum are described in this section.
Although analogue photographic imagery has many advantages, this part is mainly
concerned with image data collected by scanning systems that ultimately generate
digital image products. It is apparent that the useful wavebands are mostly in the
visible and the infrared for passive remote sensing detectors and in the radar and
microwave region for active type of sensors. Accordingly the imaging sensor systems
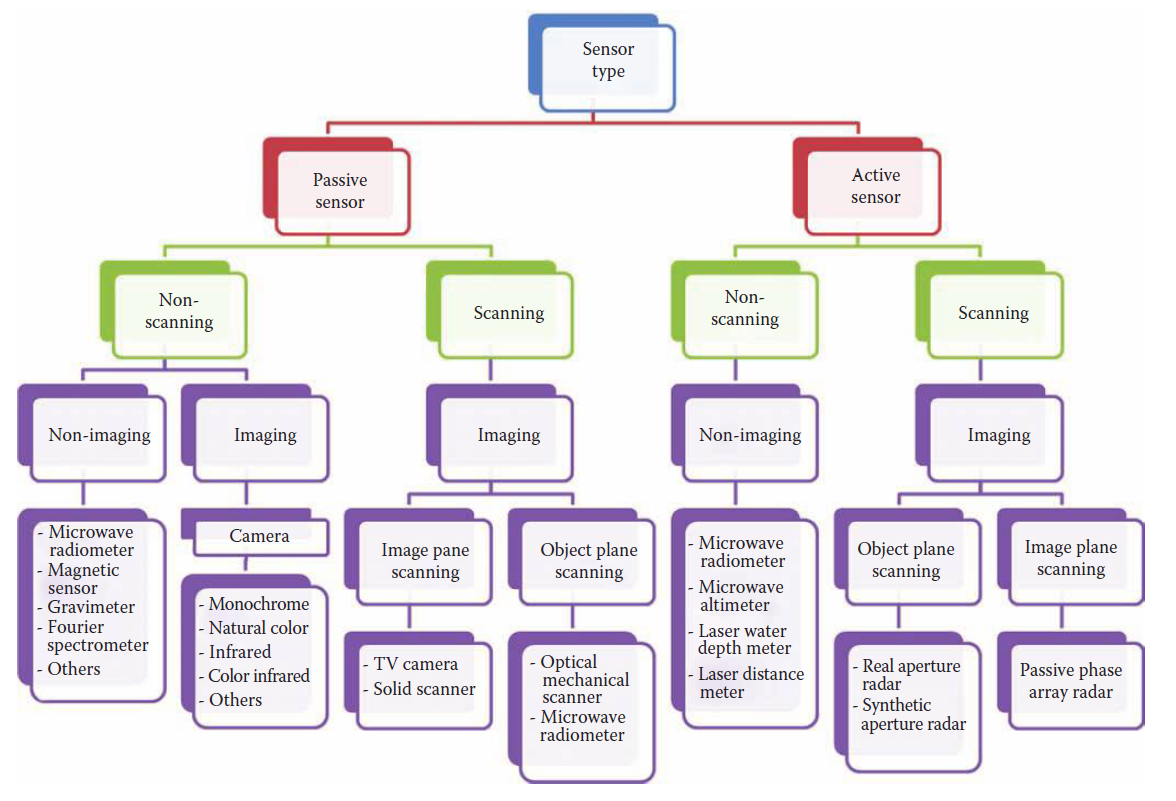
in remote sensing are classified as shown in Figure 4.
Broadly, all the imaging sensor systems are classified based on technical
components of the system and the capability of the detection by which the energy
reflected by the terrain features is recorded. The classification scheme is:
- Multispectral imaging sensor systems,
- Thermal remote sensing systems,
- Microwave radar sensing systems. The multispectral or multiband imaging systems
may use conventional type cameras or a combination of them, along with filters for
the various bands in the visible part in the scanning system of multiband imaging.
This way electromagnetic energy can be recorded by scanning the ground bit by bit.

Image Sources
National, state, provincial, or local governments are common sources of aerial
images. These photographs are often provided at a reduced cost. For example, the
National Agriculture Imagery Program (NAIP) provides coverage of much of the
lower 48 United States on an annual basis. Images are usually collected in true color,
but color infrared images may also be acquired, typically at a resolution of one
meter or better. Photographs are usually collected mid-growing season. The NAIP program
is coordinated through the USDA Farm Services Administration, and so the
images are sometimes referred to as FSA or FSA-NAIP photographs. Online and hardcopy
indexes are available to aid in identifying appropriate image mosaics.
Aerial images may also be purchased from other government agencies or from private
organizations. The USGS and U.S. Forest Service (USFS) routinely take aerial
images for specialized purposes. The USFS uses aerial images to map forest type and
condition, and often requires images at a higher spatial resolution and different time
of year than those provided by NAIP. The USGS uses aerial images in the development
of digital orthophotographs and maps. These organizations are also excellent sources of
historical aerial images. Many government agencies contribute to a national archive of
aerial images, which may be accessed at the internet addresses listed in Appendix B.
Satellite images may be obtained from various sources. Current Landsat data are
available through NASA and the USGS. SPOT, Ikonos, QuickBird, and other satellite
system data may be obtained directly from the managing sources, listed in Appendix B.
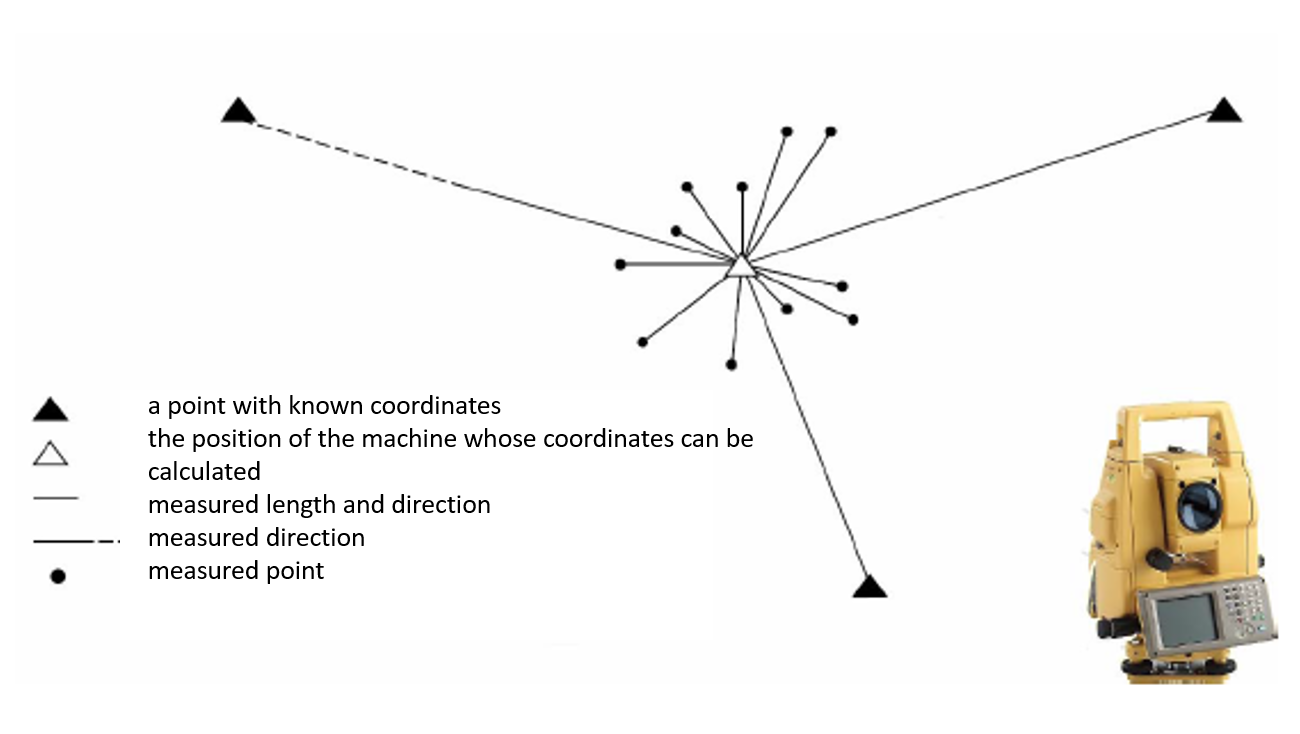
Geodetic measurements
Geodetic measurements are currently the most accurate and already the most reliable way of obtaining (geometric) information about the investigated locality. It should be based on the need to obtain some specific information in a particular location. For geodetic measurements, we usually use some form of geodetic notebook, in which we write the obtained data. We can perhaps imagine the technical implementation of an electronic geodetic notebook. We record in the notebook:
- Geographical position of the measuring element (may be part of the notebook) - typically by means of global positioning (some form of GPS). GPS systems are still evolving and achieving ever-increasing positioning accuracy.
- The value of the investigated phenomenon obtained by the measuring member.
- Time and other circumstances of the measurement, such as important influences affecting the measurement.
It can be assumed that after returning from the measurement we will transfer the data from the notebook to the acquired geodatabase and we will further edit it within postprocessing. Examples of notebooks include the popular Palm computer and ArcPAD (within the ArcGIS family).
Surveying is a geodetic activity in which the actual shape, size and location of any objects is determined. The result of this activity is, for example, a map, drawing, plan, coordinates of points, etc. From these outputs can be derived various geometric parameters, both the object and the relationships between different objects.
The most common tasks for surveying and its subsequent processing are, for example, making a map of the area, creating a base for a new construction or reconstruction project, surveying the actual design for approval, preparing construction documentation of existing buildings, surveying areas for calculating acreage, surveying terrain for cubature and more.
We use geodetic measurements to create large-scale maps (cadastral maps, technical maps, plans, etc.), as it produces vector data with an accuracy in units of cm.
Secondary data sources
Sekundární zdroje jsou dány bankou již existujících vyhotovených mapových děl. Vycházíme z předpokladu, že jejich znovupoužitím ušetříme prostředky, které bychom jinak museli vynaložit na vlastní měření. Rozlišujme:
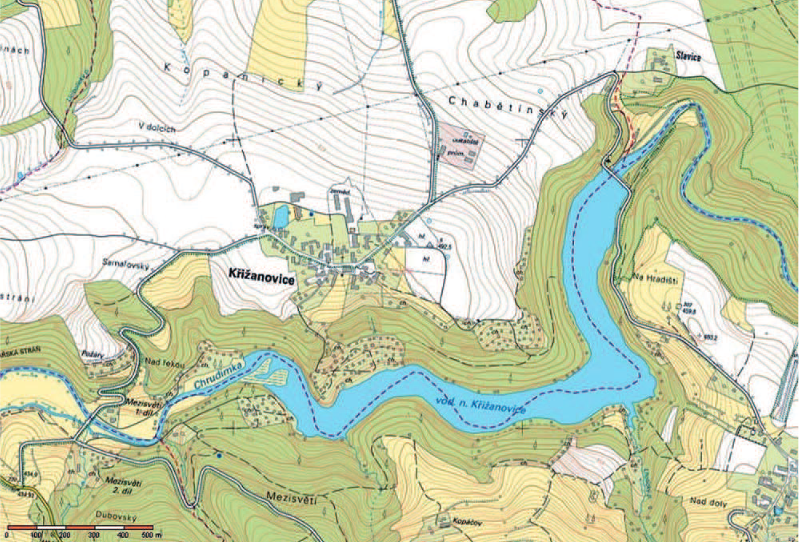
- Analogue sources - nejčastěji papírové mapy, které musíme naskenovat nebo jiným způsobem digitalizovat do podoby počítačového obrazu. Dalším zpracováním obrazu je jeho rektifikace (transformace souradného systému) a případná vektorizace.
- Digital sources v podobě existujících gisovských souborů s mapovými vrstvami. Mohou již být geokoordinovány (definovány v nějakém geografickém souřadném systému).
Obecně lze o sekundárních zdrojích, říci, že jsou v nich obsaženy chyby získané již během prvního zpracování dat, tudíž nemohou být přesnější než zpracovávané primární zdroje. Analogové zdroje lze do digitální podoby převést tzv. digitalizací.
Digitalizace mapových podkladů
Předpokládejme, že máme mapový list naskenovaný a uložený v souboru ve formě obrázku
(například TIFF). Je nutné si uvědomit, že se jedná pouze o Figure, který nemá s mapou zatím vůbec nic spolecného – obsahuje sice něco, co človek vidí jako mapu, ale tento Figure stroji nedává vůbec žádnou informaci.
Při digitalizaci mapových papírových podkladů řešíme v zásadě dva úkoly:
- Rektifikovat (geokoordinovat, georeferencovat) naskenovaný Figure - potřebujeme dát obrázku charakter mapy, což znamená ho predevším někam umístit v geografickém prostoru.
- Vektorizovat vybrané objekty v obrázku - vytáhnout z něj nekteré další vektorové vrstvy.
Georeferencování je prvním krokem zpracování skenu. Figure je matice barevných bodů a má rozměr například 1000x1000 obrazových bodů. Naše mapa je tudíž v tomto okamžiku v souřadném systému X-Y a zkoumané objekty (například hranice katastrálních parcel) mají souřadnice v rámci tohoto obrázku. Rozhodně proto nemají souřadnice v systému S-JTSK nebo WGS-84 a jsou tudíž pro GIS systém zcela nepoužitélné. Existují matematické postupy transformace těchto X-Y souřadnic do souřadných systémů GIS.
Úkolem georeferencování je tedy dát původně počítačovému obrázku charakter mapy, kde
jsme schopni v každém jejím bode určit geografickou souřadnici a měřit vzdálenost k jiným bodům. Navíc je třeba pochopit, že vstupní mapa vznikla za jistých okolností, kdy bylo použito jisté měřítko, náhradní elipsoid, případne zobrazení. To rozhodlo o usporádání objektů na ploše mapy. My se chystáme zavést Figure do obecně jiného prostředí s jinými parametry. Lze očekávat, že po importu obrázku do našeho GIS systému bude Figure vůči původní předloze zdeformovaný. Svůj účel však bude plnit.
Georeferencování je poměrně složitý algoritmus. Je naštěstí běžnou součástí GIS nástrojů. Algoritmus je založen na zadání tak zvaných referenčních bodů. Referenční bod je bod v obrázku pro který známe jeho reálnou polohu (například ve formátu šírka-délka).